![]()
![]()
![]()
![]()
| Postprocessing of Continuum Analysis |
|
|
|
|
||
Postprocessing of Continuum Analysis
Various kinds of data are generated as the result of finite element analysis. They are displacements, stresses, strains, principal stresses and their directions, etc. in case of structural analysis. Temperatures, heat fluxes , heat flow direction sand other data are obtained from heat transfer analysis. All of these analysis results are given in the form of numerical data. Their volume is huge and their content is very complex in most cases. Accordingly, it is extremely difficult to grasp the analysis results from these output data.
Postprocessing is the stage to process the analysis results and visualize them
graphically so that their contents can easily be interpreted or understood.
There a re a number of functions related to visualizing data. They create two
types of images. One is surface image type and the other is diagram type. The
former type is applied for data in surface or volume space such as plane elasticity,
plate, shell, or 3-D solid analysis. And the latter is applied to data on line
or curve space such as truss or frame analysis. Thus, one of the two different
menu titles, ![]() or
or
![]() , appears
on the menu bar depending on the type of analysis.
, appears
on the menu bar depending on the type of analysis. ![]() menu
appears when the analysis type is one of the following:
menu
appears when the analysis type is one of the following:
|
Plane stress |
|
|
Plane strain |
|
|
Axisymmetric |
|
|
Plate bending |
|
|
Shell |
|
|
3D solid |
|
|
Plane heat |
|
|
Plane seepage |
|
|
Axisymmetric seepage |
|
And, ![]() menu
appears when the analysis type is one of the following:
menu
appears when the analysis type is one of the following:
|
2-D truss |
|
|
3-D truss |
|
|
2-D frame |
|
|
3-D frame |
Postprocessing for trusses and frames is detailed in Chapter 8. Only postprocessing
of continuum analysis is described in this chapter. Whenever the analysis type
is altered by ""Project Setup" the menu title is changed to the
relevant one. Both ![]() and
and
![]() menus
appear on the menu bar, if truss or frame members are included within an analysis
of continuum structures. Each of the two menus has items appropriate for the
given analysis type. For analysis types other than truss and frame, the data
distribution is expressed for points on surfaces or in 3-D volumes. These are
the cases where
menus
appear on the menu bar, if truss or frame members are included within an analysis
of continuum structures. Each of the two menus has items appropriate for the
given analysis type. For analysis types other than truss and frame, the data
distribution is expressed for points on surfaces or in 3-D volumes. These are
the cases where ![]() menu
appears on the menu bar, as described in the previous page.
menu
appears on the menu bar, as described in the previous page.
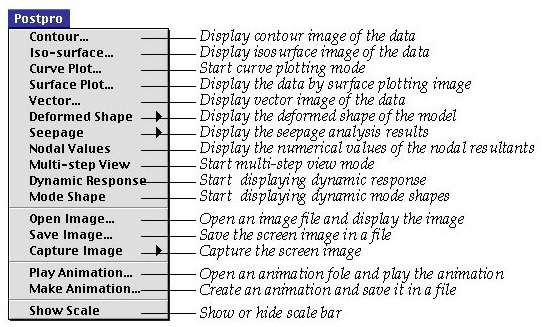
The data obtained from continuum analysis can be divided into two types. One
is scalar data, and the other is vector
data. Scalar data have information of magnitude only. The following functions
are provided as items under ![]() menu
for visualization of scalar data:
menu
for visualization of scalar data:
Vector data have information of magnitude and spatial direction. There are
the following functions under ![]() menu
for visualization of scalar data:
menu
for visualization of scalar data:
|
displaying deformed shape |
|
| nodal resultant |
There are also other auxiliary functions related with postprocessing. VisualFEA has the capability of image handling and animation. Related commands are provided under menu.
|
|
|
|