![]()
![]()
![]()
![]()
| Postprocessing of Continuum Analysis > Visualizing Scalar Data by Contours > Setting contouring options |
|
|
|
|
||
Setting contouring options
In oder to get contour image of a data set, first select "Contour.
. ." item from ![]() menu. Then, "Contour Display" dialog appears on the screen. There
are a number of items in this dialog. Each item has a default setting. Change
the setting if necessary. You may also specify the scale of contour bands. Click
menu. Then, "Contour Display" dialog appears on the screen. There
are a number of items in this dialog. Each item has a default setting. Change
the setting if necessary. You may also specify the scale of contour bands. Click
![]() button
if every item is set as desired. Then, the contour image will be displayed with
a scale bar which indicates the ranges of data values represented
by contour bands.
button
if every item is set as desired. Then, the contour image will be displayed with
a scale bar which indicates the ranges of data values represented
by contour bands.
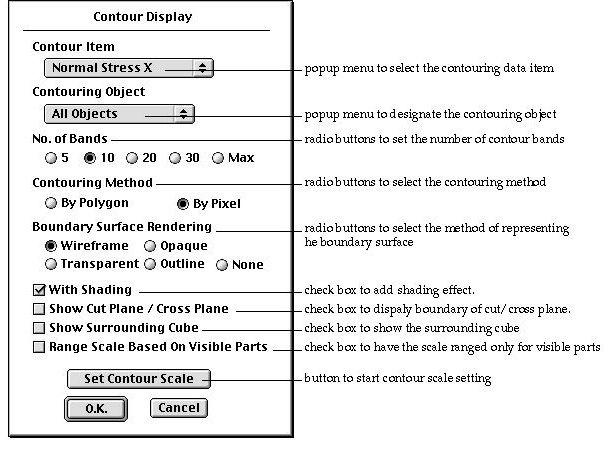
< "Contour Display" dialog >
The popup menu in "Contour Display" dialog has the list of data items which can be displayed by contouring. One of the items should be selected from this popup menu. The data associated with the currently selected popup menu item is rendered in contour. The first item is always selected initially when the "Contour Display" dialog is first opened. But the item used for last contouring will be selected automatically when the dialog is opened next. The popup menu items vary depending on the analysis type. Only those output items appropriate for contouring appear on the popup menu. They are shown below.
All the items are not always shown in the popup menu. If you exclude any of the output items in "Analysis Options" dialog described in Chapter 6, the corresponding item(s) will not be shown. If you are using an external solver, the menu items may be different from those shown below, because the popup menu items can be customized by the external.
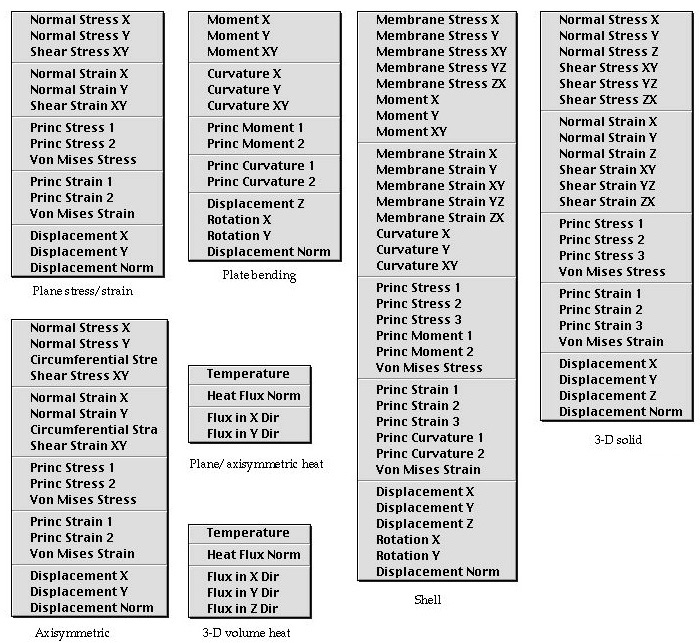
<Popup menu selecting the contouring data item >
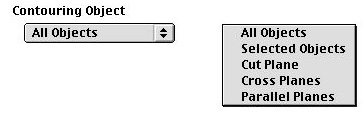
> Designating the contouring object
The object of a contour image is not necessarily the entire model. Contours
may be drawn only on the selected part of the model, or on a pre-defined object
such as a cut plane, cross planes, or parallel planes. These planes are defined
using respective tools![]() ,
,
![]() , and
, and
![]() .
.
|
"All Objects" : Contours are rendered on all objects, that is, on all the surfaces included in the model. In case of a 3-D solid structure or volume heat model, all boundary surfaces are used for contouring. |
|
|
"Selected Objects" : Contours are rendered only on the selected
surfaces or volumes. In the case of a volume, its boundary surfaces are
used for contouring. This popup menu item is active only when at least
one or more objects are selected using |
|
|
"Cut Plane" : Contours are rendered on the cut plane. This
popup menu item is active only when the cut plane is defined using tool
|
|
| "Cross Planes" : Contours are rendered on the cross
plane. This popup menu item is active only when the cross planes are defined
using tool |
|
| "Parallel Planes" : Contours are rendered on the
parallel planes. This popup menu item is active only when the parallel planes
are defined using tool |

<Various contouring objects>
> Setting the number of contour bands
The contour image has a number of contour bands, each of which re p resents a certain range of data value. The number of bands is initially set as 10 by default. This default setting can be changed by clicking the radio button labeled with the desired number of bands, which should be one of 5, 10 , 20, 30 and Max. If you choose "Max" the contour image will be rendered with as many bands as possible using the available colors. In this case, the color variation is so smooth that the boundaries between contour bands may not be recognizable.
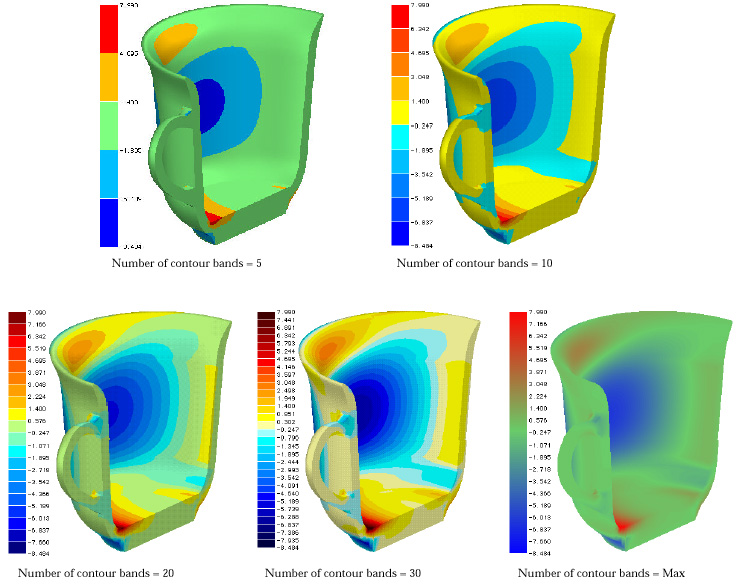
<Comparison of number of contour bands>
> Selecting the contouring method
VisualFEA creates contour images either by polygon fill or by pixel painting. Contouring by polygon fill is faster, while pixel painting produces better quality image. You can select either one of the two using the radio buttons in the dialog. The initial default setting is "By polygon" but can be changed by the preference setting.
> Selecting the style of boundary surface rendering
Boundary surface rendering is applicable only in case the contouring object is set as a cut plane, cross planes or parallel planes defined prior to starting "Contour Display" dialog.
|
"Wireframe" : The boundary surfaces are rendered in the form of wireframe. The hidden lines are removed from the wireframe rendering. |
|
| "Opaque" : The boundary surfaces are rendered by opaque shading. The front side of the cut plane, cross planes or parallel planes are rendered together with the boundary surfaces in the back sides. | |
| "Transparent" : The boundary surfaces are rendered in transparency shading. The cut plane, cross planes or parallel planes are rendered as opaque objects surrounded by transparent boundary surfaces. | |
| "Outline" : The outlines of the boundary surfaces are extracted, and reresented together with the contour image on cut plane, cross planes or parallel planes. | |
| "None" : The contour image is displayed without boundary surface rendering. |
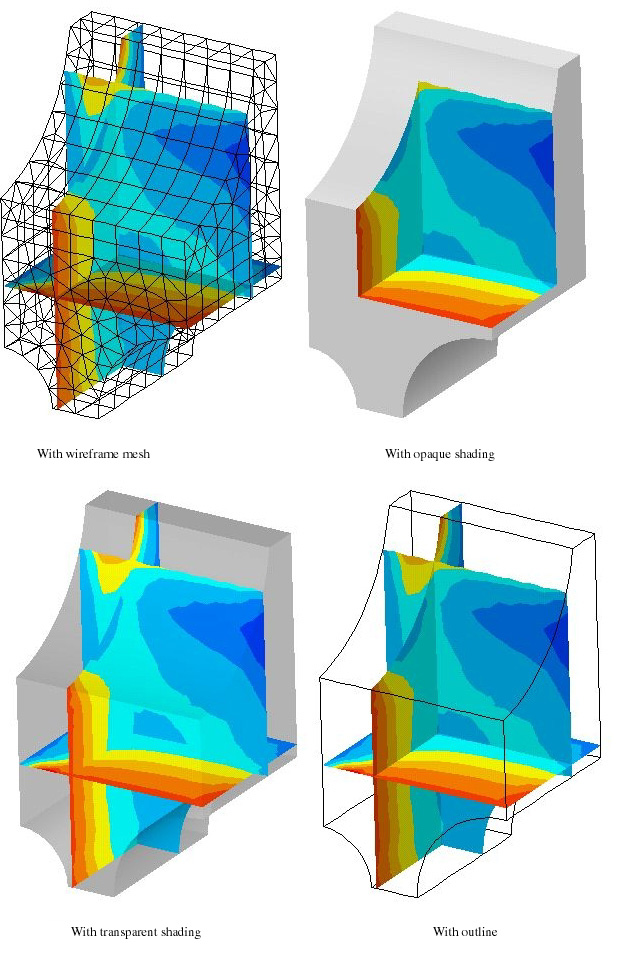
<Styles of boundary surface rendering>
> Turning the shading effect on or off
It is desirable to add shading effect on contour images of 3 dimensional objects, in order to maintain the 3-D view after contouring. Shading effect can be turned on or off by checking or unchecking the check box labeled "With Shading" Addition of the shading effect will require more time for contouring. For 2 dimensional planar models, the shading effect will not be applied regardless of this option.
> Displaying the boundary of cut or cross planes
The boundary lines of a cut plane or cross planes are displayed together with the contour image, if "Show Cut Plane/Cross Plane" box is checked. This option is valid only when the contour is drawn over the cut plane or the cross planes defined prior to starting "Contour Display" dialog.
> Displaying the cube surrounding the entire model
The cube surrounding the model is displayed together with the contour image, if "Show Surrounding Cube" box is checked. This option is valid only when the contour is drawn over the cut plane or the cross planes defined prior to starting "Contour Display" dialog.
> Limiting the range of contour scale by actually displayed values
The contour image is not always drawn for the entire model. A contour image may be drawn only on the selected parts or on the visible parts. In such cases, the range of the actually contoured data may be much narrower than that of the whole data. The scale of the contour can be adjusted to the actual range of the displayed part rather than that of the entire model, by checking the box labeled "Range Scale Based On Visible Parts".
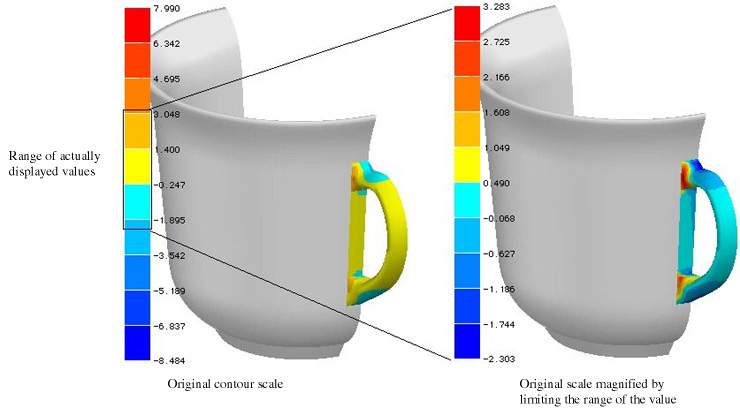
<Limiting the range of the contour scale>
|
|
|
|