| Visual Instruction of Shape Function and Interpolation | |
|
| |
||
Visual Instruction of Shape Function and Interpolation
In the finite element method, the value of an arbitrary point within an element
is generally approximated by interpolating the values at nodes of the element.
The function used in the interpolation is usually called a ”shape function”.
VisualFEA/CBT has an educational function to visualize graphically the shape
functions and their derivatives employed in finite element modeling, and thus
to help understanding their concept and behavior. This function is intended
for visual instruction on the concept of shape function, and especially for
better understanding of their variation and continuity within an element and
across adjacent elements. The shape function can be examined using any one or
more element(s) sampled f rom actual finite element model. Shape functions and
their derivatives are represented by 3-dimensional surface models. The model
may include not only a single shape function but also combination of two or
more shape functions. Thus, one may understand easily how the behavior of finite
elements can be represented by using shape functions.
The interpolation model is rendered by either wireframe, smooth
shading or contouring, whichever is most appropriate for better visualization.
Numerical values of the function at integration points or a selected point may
be displayed in text string. The view of the model can be transformed easily.
This function is applicable only for plane stress/strain,
axisymmetric, and plate bending elements.
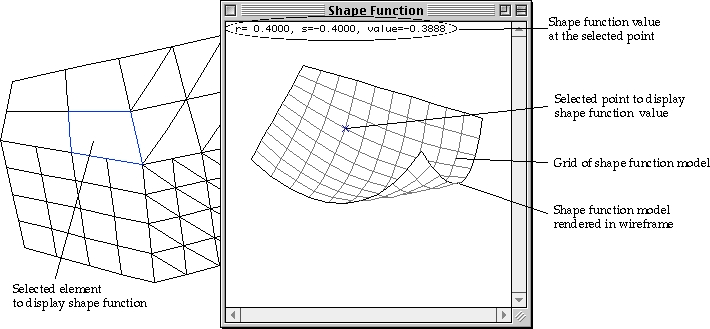
<Displaying the interpolation model>
|
|
|
|