![]()
![]()
![]()
![]()
| Diagrams for Frame Analysis |
|
|
|
|
||
VisualFEA includes 2-D truss, 3-D truss, 2-D rigid frame and 3-D rigid frame
in the category of frame analysis. Here, frame is the general name of both truss
and rigid frame. The geometry of a frame is modeled by lines. Various kinds
of data are generated from frame analysis: displacements, axial forces, shear
forces, bending moments, etc. Owing to the characteristics of geometry and data
in frame analysis, visualization of its results can be achieved more effectively
by diagrams than surface images described in Chapter 7. Thus, ![]() instead of
instead of ![]() menu,
appears on the menu bar if the analysis type is one of the following.
menu,
appears on the menu bar if the analysis type is one of the following.
|
2-D truss |
|
|
3-D truss |
|
|
2-D frame |
|
|
3-D frame |
The procedure of frame analysis can be divided into the same three stages as in continuum analysis: preprocesing, analysis, and postprocessing. However, VisualFEA enables the users going back and forth through the whole procedure of frame analysis so interactively and freely that these stages may not be distinctive to the users. At the moment a menu item is selected, the corresponding diagram is instantly displayed. Thus, the user may feel as if the analysis stage were bypassed, although all the necessary steps were completed in a short period of time.
Furthermore, whole cycle of frame analysis can be processed in real time. For example, the bending moment diagram of a frame is updated in real time, while its geometry is being modified. VisualFEA provides an option to take the above 3 stages step by step if desired, as in the case of continuum analysis.
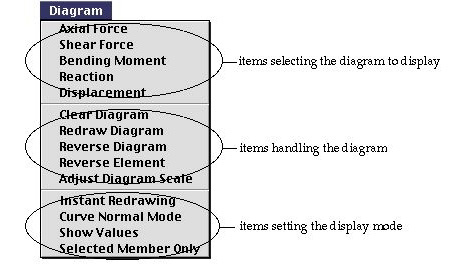
The menu is composed of three parts as shown below. The first part of the menu consists of the items to select the diagram, the second part consists of items to handle the diagrams, and the last part consists of items to set the display modes.
|
|
|
|