Visual Instruction of Shape Function and Interpolation
|
Visual Instruction of Shape Function and Interpolation |
|
|
| |
||
Manipulating interpolation model
The value at an arbitrary point within an element is interpolated from the nodal values using the relation,
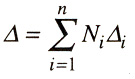
where represents the value at the given point, i the value at node i, and Ni is the value of the shape function of node i at the point. n is the number of nodes within the element. If you click a point within the interpolation model, the numerical value of at that point is displayed together with the natural coordinates of that point on the top of the window.
Either each one of these shape functions or linear combination of multiple shape functions can be displayed and manipulated interactively as described below.
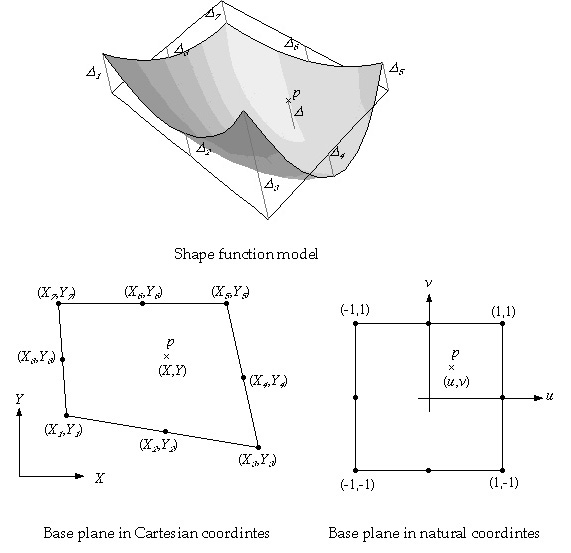
< Interpolation model >
Displaying a single shape function
The interpolation model may be used to represent a single shape function, i.e., a shape function of a certain node. This can be achieved simply by double clicking the node of the interpolation model. Then, the nodal value of the node is set to unity, while the values of all the other nodes are cleared. Thus, the interpolation model becomes identical to the shape function itself of that node. For example, if you click node 3 of the interpolation model formed by a 8 node quadrilateral element, then,
D3 = 1, D1 = D2 = D4 = ... D8 = 0,
and thus,
D = N3 x 1 = N3 .
The above equation implies that the value at arbitrary point, is identical toN3,. Therefore, the interpolation model re p resents N3, itself as shown in the figure below.
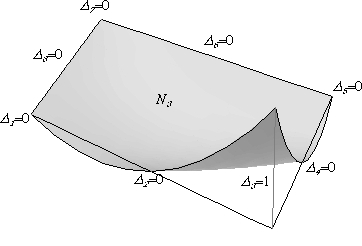
<Displaying a single shape function>
Assigning nodal values to the interpolation model
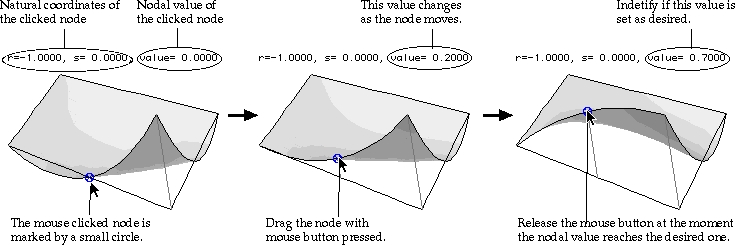
Instead of a single shape function as described above, the interpolation model may also re p resent multiple shape functions by their linear combination. This can be achieved simply by assigning a certain value to each node, i.e. i to node i. The desired values may be assigned to the nodes of the interpolation model by the following procedures.
|
1) Click the node, whose value is to be adjusted. The clicked node in the interpolation model is marked by a small circle. |
|
|
2) Drag the node with mouse button pressed. The node moves along with the cursor, and accordingly the nodal value changes. The nodal value is displayed on the top of the window. |
|
|
3) Release the mouse button when the nodal value reaches the desired value. Watch the text string of the nodal value on the top of the window. The nodal value freezes at the moment the mouse button is released. |
The nodal values changes in multiples of 0.1. By pressing the ![]() key
while dragging the node, it is changed into a multiple of 1.
key
while dragging the node, it is changed into a multiple of 1.
<Assigning a nodal value>
Clearing nodal values
All the nodal values assigned to the interpolation model can be removed at
once by choosing "Clear Function Value" item from ![]() menu. The interpolation model is reset to the state of the base plane, and rendering
of the model is updated accordingly.
menu. The interpolation model is reset to the state of the base plane, and rendering
of the model is updated accordingly.
Displaying shape function derivatives
The interpolation model can be used to display not only the shape function itself but also its derivatives. Choose an item from menu to switch the content displayed on "Shape Function" window.
|
“Function Value” : Shape function Ni, or interpolated value is displayed, if this menu item is checked. |
|
|
“Derivative w.r.t. X” : Derivative with respect to X, of shape function ¶Ni / ¶x or of interpolated value ¶D / ¶x is displayed, if this menu item is checked. |
|
|
“Derivative w.r.t. Y” : Derivative with respect to X, of shape function ¶Ni / ¶y or of interpolated value ¶D / ¶y is displayed, if this menu item is checked. |
|
|
“Cross Derivative” : Cross derivative of shape function ¶2Ni / ¶x¶y or of interpolated value ¶2D / ¶x¶y is displayed, if this menu item is checked. |
|
|
“Second Derivative w. r.t. X” : Derivative with respect to X, of shape function ¶2Ni / ¶x2 or of interpolated value ¶2D / ¶x2 is displayed, if this menu item is checked. |
|
|
“Second Derivative w. r.t. Y” : Derivative with respect to X, of shape function ¶2Ni / ¶y2 or of interpolated value ¶2D / ¶y2 is displayed, if this menu item is checked. |
For lower order elements such as 3 node triangles, the second derivative turns out to be zero, and thus the interpolation model lies flat on the base plane. Assigning a nodal value to the interpolation model is allowed only when the shape function itself is displayed. The nodal value cannot be altered while the derivative or the second derivative is shown on the window.
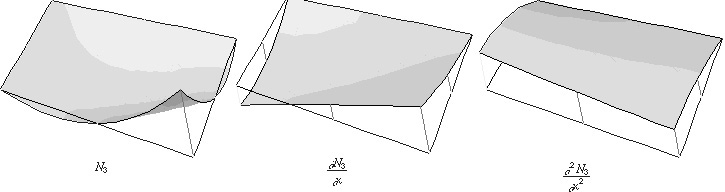
<Comparison of shape function, its derivate and its second derivate>
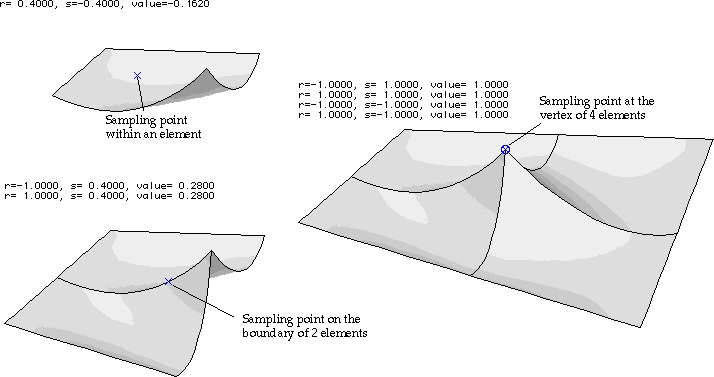
Sampling the value at a point
The shape function or its derivatives can be sampled at a selected point on the interpolation model for display of its numerical value. Click a point on the interpolation model. Then, the point is marked with ´, and the text on the top of the window indicates the natural coordinates of the point and the numerical value of shape function or its derivatives, which is under display. The sampling point can be selected only from one of the grid points on the interpolation model. If the interpolation model includes more than one element and the clicked point is shared by two or more elements, then the natural coordinates and the numerical value of the model are displayed for each of the elements sharing the point.
The displayed text can be removed by clicking any point outside the interpolation model.
< Comparison of shape function, its derivative and its second derivative >
Displaying the value at integration pointsDisplaying the value at integration points
The value of a shape function or its derivatives on the integration points
can also be displayed by text string. Select “Show Integration Point” item from
![]() menu. Then, the integration points are ´ marked, and the numerical values are
displayed next to the mark. The integration points are determined by the integration
rule defined for each element type. The integration rule can be altered if necessary.
It is described under the title “Specifying integration scheme” in Chapter 6.
menu. Then, the integration points are ´ marked, and the numerical values are
displayed next to the mark. The integration points are determined by the integration
rule defined for each element type. The integration rule can be altered if necessary.
It is described under the title “Specifying integration scheme” in Chapter 6.
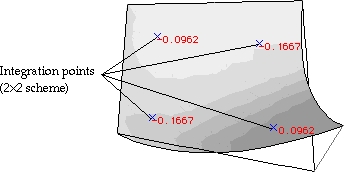
<Displaying the values at integration points>
|
|
|
|