Overview > Finite Element Anaylsis and VisualFEA > Visualizing analysis results using VisualFEA
![]()
![]()
![]()
![]()
|
Overview > Finite Element Anaylsis and VisualFEA > Visualizing analysis results using VisualFEA |
|
|
|
|
||
Visualizing analysis results using VisualFEA
The data obtained as the result of finite element analysis are very extensive, and therefore can hardly be grasped unless they are graphically visualized. VisualFEA has a number of functions to visualize the analysis results by graphical image. T h e re are two types of images. One is surface images for 2 or 3 dimensional continua, and the other is diagram images for trusses and frames. The continuum data can be split into two types: scalar data which have only magnitudes, and vector data which has directions as well as magnitudes. Different methods of visualization are applied depending on the type of the data.
Visualization of analysis results is the most spectacular part of VisualFEA.
> Visualization of scalar data
Stresses, strains and temperatures are examples of scalar data obtained from finite element analysis. The most widely used method of visualizing scalar data i s contouring. The data distribution is represented by a number of contour lines or bands. However, contouring is limited to re p resenting the data on planes or surfaces. Data distribution within 3 dimensional volumes cannot be represented directly using contours, but can be visualized properly with the aid of volume visualization tools. Volume visualization can also be achieved by iso-surface rendering. There are other methods of visualizing scalar data such as graph and level surface representation.
> Visualization of vector data
Examples of vector data are displacements, reaction forces, heat fluxes and principal directions. The most widely used method of visualizing vector data is arrow representation. Different types of arrow representation are available for planes, curved surfaces, or 3 dimensional volumes. Vector data like displacements can be represented effectively by deformed shape of the model.
> Visualization of truss and frame data
The analysis results of trusses and frames are best expressed by diagram images. Member forces such as bending moments, shear forces and axial forces are represented by diagrams. Diagrams are drawn in continuous curves to represent the variation of the values across the frame members.
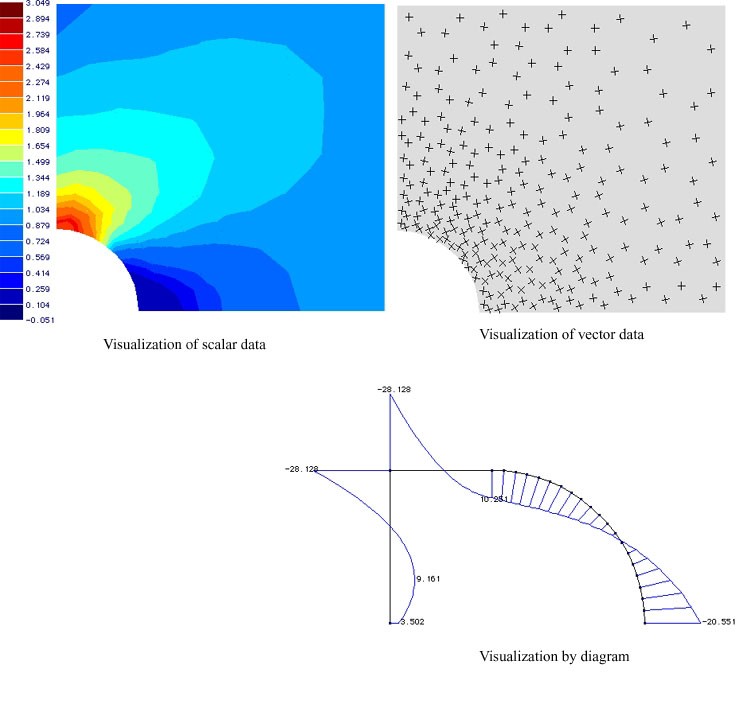
< Different methods of visualizing analysis results >
|
|
|
|